First, let’s define what LSI actually is — and what it is not
The Langelier Saturation Index (LSI) is one of the most cited, most trusted, and most misunderstood numbers in industrial water treatment.
Here is the precise, honest definition:
LSI indicates only the potential for calcium carbonate (CaCO₃) to precipitate or dissolve. A positive LSI suggests the water tends toward depositing CaCO₃; a negative LSI suggests it tends toward dissolving it. That is the entire scope of the number.
That’s it. LSI is a directional thermodynamic flag for one mineral — calcite — in relatively simple, low-TDS waters. It was developed in 1936 for municipal distribution systems to answer a single, narrow question: will this water tend to lay down a protective carbonate film, or strip it away?
Now here is what LSI is not, despite how the industry routinely uses it:
- LSI is not a corrosion index. It contains no corrosion term — no dissolved oxygen, no chloride aggressiveness, no galvanic driver, no microbiologically influenced corrosion. The persistent myth that “positive LSI = scale, negative LSI = corrosion” has no thermodynamic basis.
- LSI is not a scaling-rate predictor. It tells you nothing about kinetics, induction time, or how fast a deposit forms.
- LSI is not inhibitor-aware. It has no idea whether you are dosing HEDP, polymeric CaCO₃ inhibitors, phosphonates, or AA/AMPS polymers — or whether those inhibitors are still working.
- LSI is not a true saturation value. And this is the heart of the problem.
The mathematical claim hiding inside LSI
By construction, LSI is meant to approximate the base-10 logarithm of the calcite saturation ratio: LSI ≈ log₁₀(SRcalcite), where SRcalcite = IAP / Ksp.
So in the idealized textbook world, an LSI of 2.5 should mean SR ≈ 316. Clean, simple, and the basis of nearly every legacy control limit ever written.
The trouble is that the approximation only holds for the simple, low-ionic-strength waters LSI was built for. LSI computes a saturation pH (pHs) from empirical lookup factors for temperature, calcium, alkalinity, and TDS. It assumes ideal behavior, ignores ion pairing, and treats the water as if calcite were the only thing happening. Real industrial cooling water is none of those things.
The real-world consequence: your inhibitor fails on SR, not on LSI
Here is why this matters far beyond academic precision. Scale inhibitors don’t read your LSI. They respond to the true saturation ratio of the mineral they’re holding back. Every threshold inhibitor — HEDP, phosphonates, polymeric CaCO₃ inhibitors, polyacrylates, AA/AMPS — has a saturation ceiling above which it simply stops working, no matter how much you dose. That ceiling is expressed in SR, not in LSI.
The industry, however, has spent decades writing those ceilings in LSI — because LSI was the only number on the report. And that is exactly where programs quietly fail.
HEDP is the cleanest example. The field rule of thumb is that an HEDP-based program is “fine” up to roughly LSI 2.5. But HEDP’s actual failure point is a saturation ceiling: it loses control of calcium carbonate at a true SR(calcite) of about 145, regardless of dose. Push past that ceiling and adding more inhibitor buys you nothing — crystal growth simply outruns the threshold mechanism.
So the critical question becomes: when an operator reports LSI 2.5, what is the true SR(calcite) actually doing?
To answer that rigorously, I took seven real Gulf-Coast source waters from the Texas and Louisiana industrial corridor — the Brazos, Trinity, and Neches Rivers, the Sabine/Calcasieu system, the Mississippi River at Baton Rouge, and the Chicot and Evangeline aquifers — and ran them through a full saturation model built from scratch on rigorous ion speciation. Each water was cycled from 1.0 to 17.0 cycles of concentration, with pH driven from 6.8 to 8.8 by acid feed and alkalinity destruction, and evaluated at heat-exchanger skin temperature (120–170°F) — because scale forms on the hot metal, not in the basin. That produced 322,322 individual saturation calculations.
Crucially: the true calcite saturation in every one of those runs was computed entirely from ion speciation — activity coefficients, ion pairing, and temperature-corrected Ksp — with no LSI term anywhere in the math. LSI was calculated separately, only so we can plot the number a practitioner would have reported against the saturation that actually exists.
The true saturation diverges from the textbook value for several physical reasons, all of which worsen as the water concentrates:
- Ionic strength & activity coefficients — At cycled-up cooling-water TDS, the effective (active) concentrations of Ca²⁺ and CO₃²⁻ are far below their analytical concentrations.
- Ion pairing and complexation — Mg²⁺, Sr²⁺, SO₄²⁻, and others tie up free calcium and carbonate.
- Temperature & Ksp — Skin/heat-exchanger surface temperature governs saturation at the place scale forms.
- pHs approximation error — The classical Langelier pHs isn’t the true equilibrium pH in a complex mixed-salt matrix.
What’s actually happening at LSI 2.5 — the HEDP failure point
Take that single reported LSI of 2.5, the value the industry treats as HEDP’s comfort zone. Here is what the seven real waters actually produce in the saturation model:
| True SR(calcite) at LSI ≈ 2.5 | |
|---|---|
| Across all seven Gulf-Coast waters | ≈ 76 – 188 |
| Median across the dataset | ≈ 151 |
| HEDP failure ceiling | ≈ 145 |
At a reported LSI of 2.5, more than half of these real waters are already at or past HEDP’s true failure ceiling of ~145 SR(calcite) — and the operator has no way of knowing it from the index. The median water at LSI 2.5 sits at SR ≈ 151, slightly above the point where adding more HEDP stops helping. One water reads SR 76 (comfortably controlled); another reads SR 188 (well past failure). Same LSI on the report. Opposite outcomes on the tubes.
This is the failure mode nobody trends: the program was dosed correctly, the LSI looked safe, and the heat exchanger fouled anyway — because the inhibitor’s real ceiling is a saturation value the index never showed.
Polymeric CaCO₃ inhibitors: even less headroom than you think
The polymeric CaCO₃ inhibitor class is the next tier up — historically trusted to hold calcium carbonate out to roughly LSI 3.0, supposedly giving you a comfortable half-index of extra margin over HEDP. In true-saturation terms, that margin is far smaller than the index suggests.
The polymeric inhibitor’s empirical failure point is a true SR(calcite) of about 220, regardless of dose — and in these real Gulf-Coast waters that ceiling is reached by LSI 2.75, not the LSI 3.0 the industry quotes. Put the two failure points side by side and the lesson is stark:
| Inhibitor | Reported LSI at failure | True SR(calcite) at failure |
|---|---|---|
| HEDP | ≈ 2.5 | ≈ 145 |
| Polymeric CaCO₃ inhibitor | ≈ 2.75 | ≈ 220 |
On the index, the polymeric inhibitor is sold as a half-index upgrade (good to ~LSI 3.0). In the saturation that actually governs deposition, it buys you only about 75 SR units — from ~145 to ~220 — and that ceiling arrives by LSI 2.75. The index makes the upgrade look far more generous than the chemistry delivers. And here is the trap: in these real waters, true SR is already pushing past 220 in the LSI 2.7–2.8 range, well before the index reaches the “polymer-safe” 3.0 mark. So a program confident at “LSI 2.8, polymer-protected” may already be sitting past the polymeric inhibitor’s true failure point.
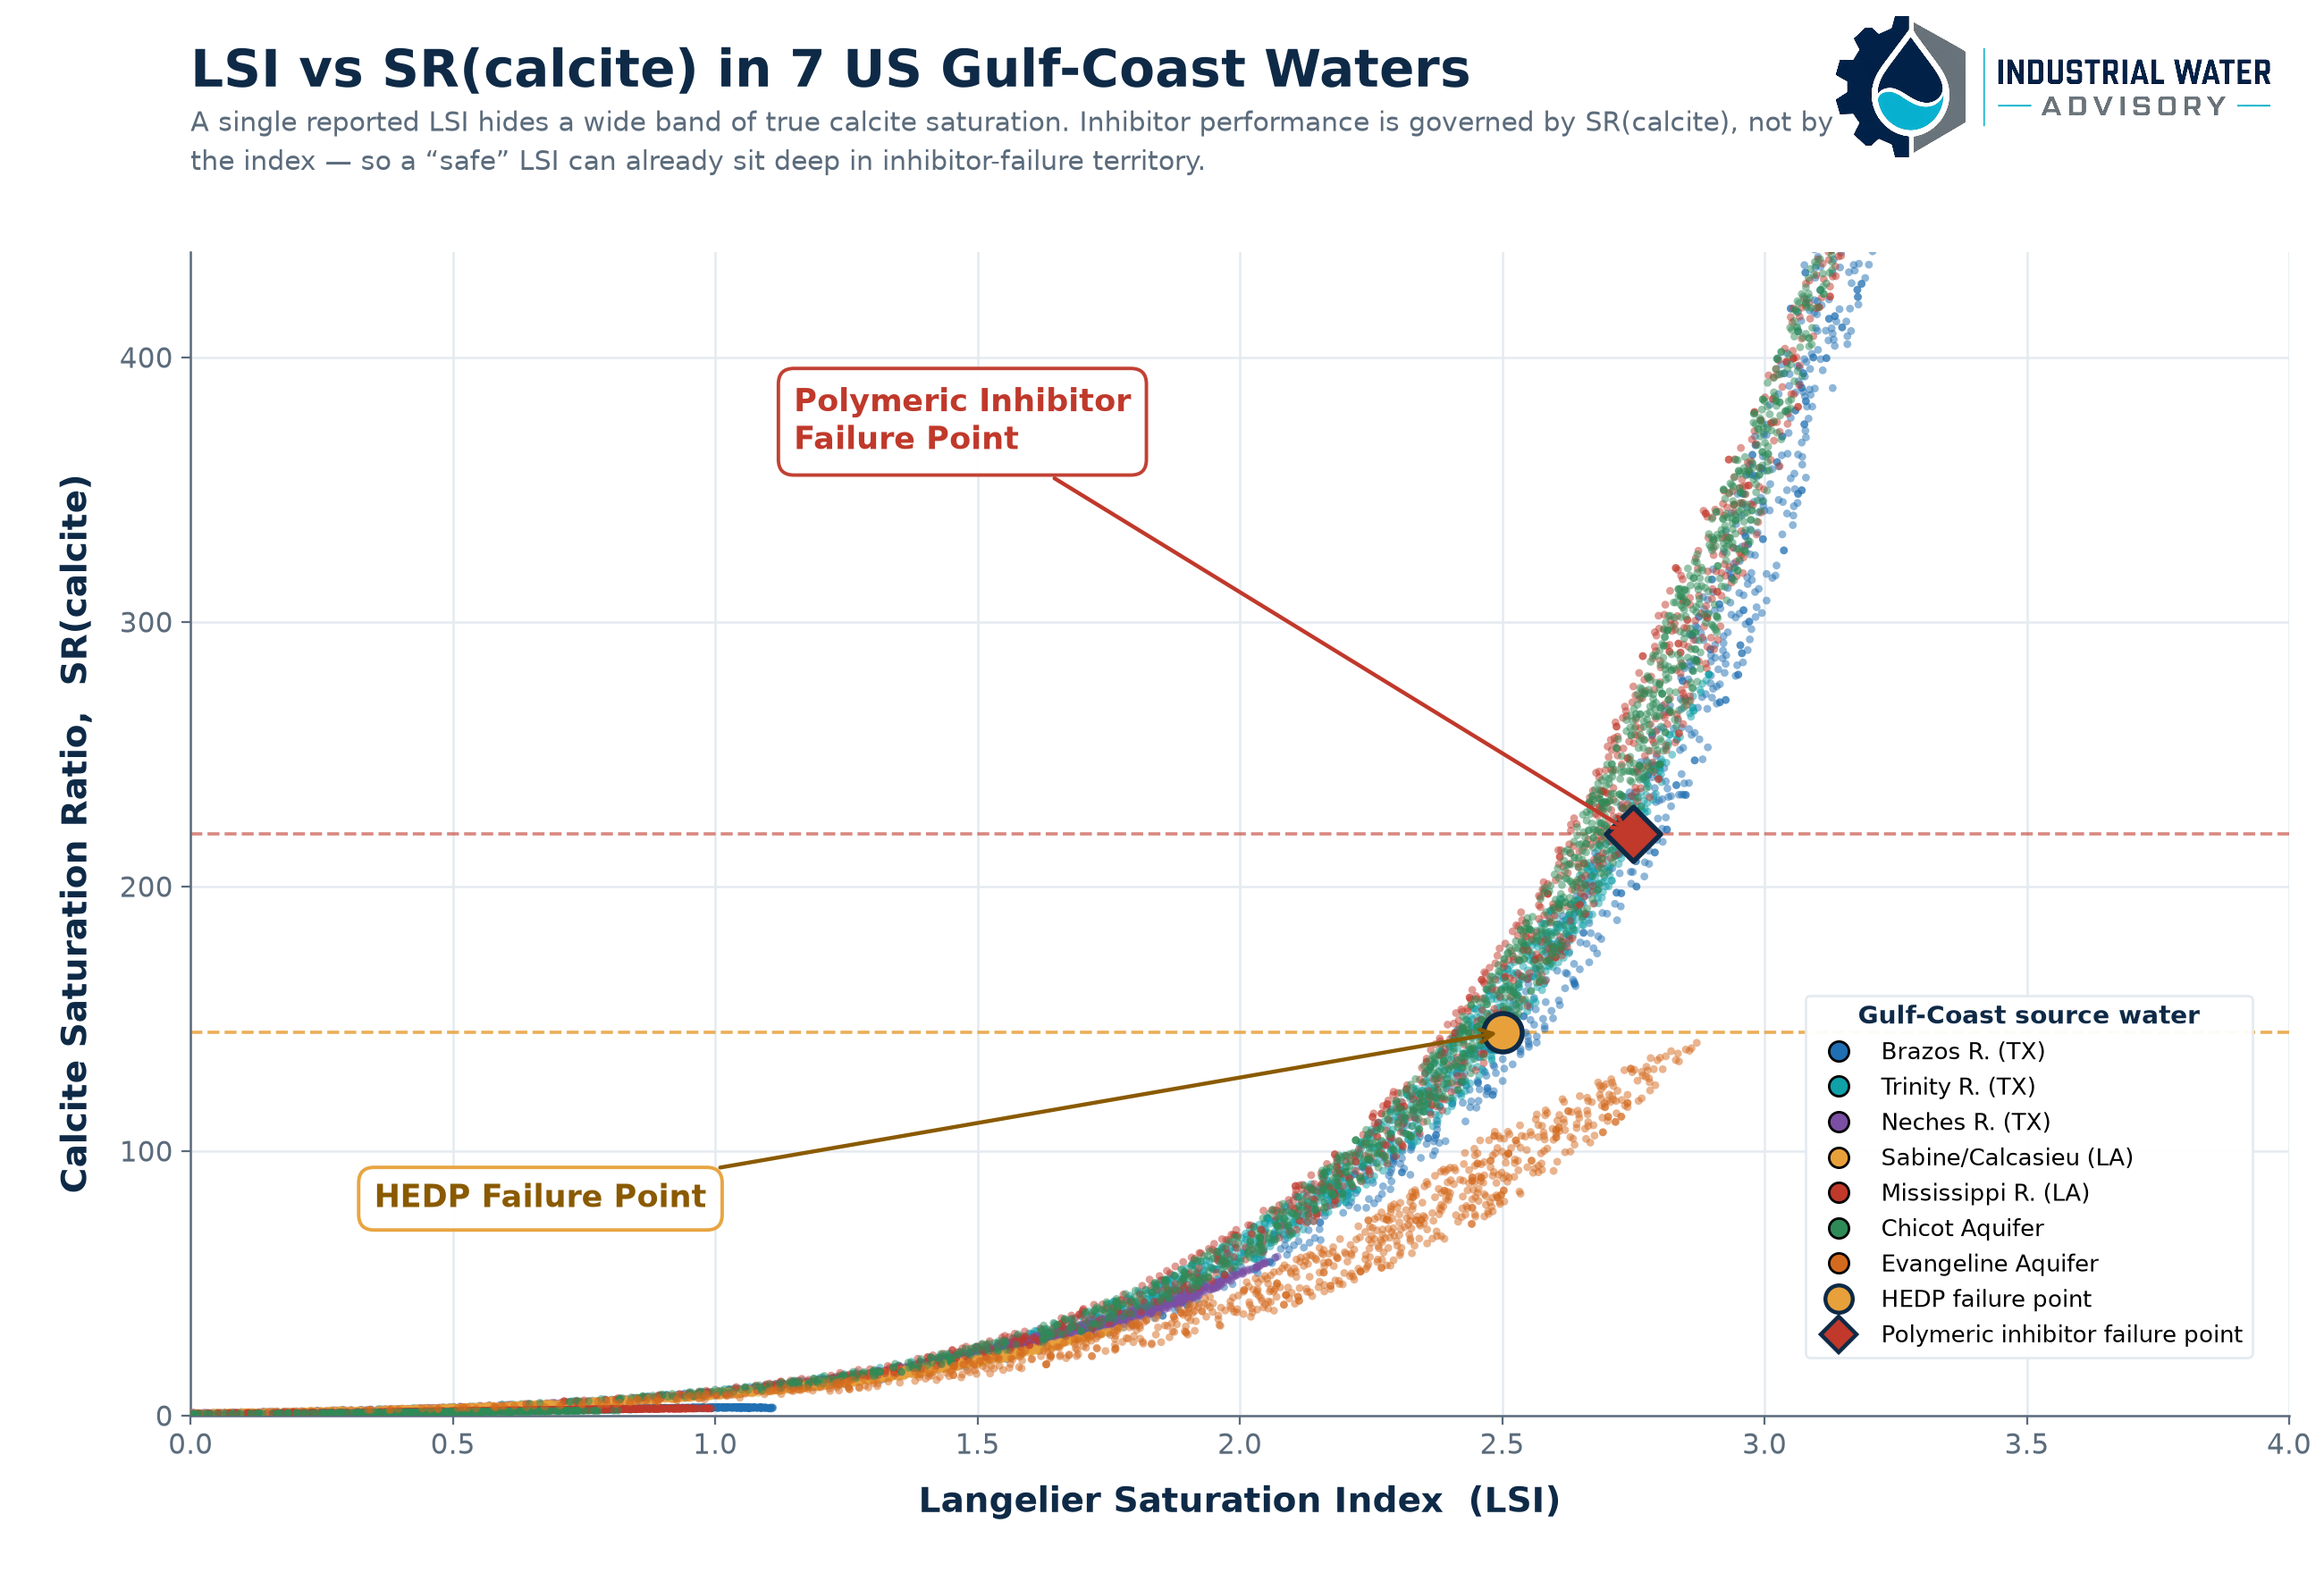
The figure below makes the whole picture concrete. Every point is a real saturation-model result, colored by source water, plotted on a linear SR axis so the spread is honest. The amber circle is HEDP’s empirical failure point (LSI ≈ 2.5, SR ≈ 145); the red diamond is the polymeric CaCO₃ inhibitor’s empirical failure point (LSI ≈ 2.75, SR ≈ 220). Notice how close the two SR ceilings sit — and how wide the cloud of true SR becomes at any single LSI, so that real waters cross both ceilings at index values the industry still calls “safe.”
Failure points matter — but dosage and cost are where SR(calcite) pays for itself every day
The inhibitor failure points are the dramatic part of this story, and rightly so: cross HEDP’s ~145 ceiling or the polymeric inhibitor’s ~220 ceiling and your program is failing no matter what the index says. But there is a second, quieter consequence that affects the budget on every single day the plant runs well — not just on the bad days.
Inhibitor dosage and chemical cost can be optimized on SR(calcite). They can never be optimized on LSI. Here is why.
Threshold inhibitor demand scales with the actual supersaturation the inhibitor has to hold back — the true driving force for crystal nucleation and growth. That driving force is SR(calcite). When you know the real saturation ratio, you know how hard the inhibitor is actually working, and you can dose to the real demand:
- Below the ceiling, with margin to spare — if the true SR sits well under the inhibitor’s failure point, you are very likely overdosing. The supersaturation simply isn’t there to justify the feed rate, and you can trim chemical cost with no increase in scaling risk.
- Approaching the ceiling — demand rises steeply, and SR(calcite) tells you exactly how much headroom is left before more inhibitor stops buying control. You feed to the actual edge of effectiveness, not to a guess.
- Past the ceiling — SR(calcite) tells you to stop adding chemical entirely and pull a different lever (cycles, acid, blend, side-stream), because additional inhibitor is now pure waste.
Now contrast that with LSI. Because a single LSI value can correspond to a true SR anywhere across a wide band — SR 76 to 188 at LSI 2.5 in these seven waters alone — an LSI-based dose is a dose set to the wrong number. You cannot tell, from the index, whether you are comfortably below the ceiling (and overspending on chemical) or already past it (and wasting every drop you add). Two plants running the identical LSI and the identical dose can be in completely opposite economic and risk positions, and the index gives neither operator a way to know.
The practical result on the SR(calcite) basis is two-sided and both sides are money:
- Cost reduction when you have margin. Plants controlling on a conservative LSI limit are routinely carrying inhibitor feed rates well above true demand — paying for supersaturation that isn’t there. Dosing to real SR(calcite) demand recovers that spend directly.
- Risk and asset protection when you don’t. When SR is climbing toward the ceiling — a higher-cycle summer day, a makeup-chemistry shift, a hot skin-temperature excursion — SR(calcite) flags it before the inhibitor quietly tops out, while LSI is still reading “safe.”
LSI cannot do either of these, ever, even in principle — not because it is calibrated poorly, but because it is not the variable the inhibitor responds to. Optimization requires the true cost-versus-control curve, and that curve is drawn on SR(calcite). This is the difference between running blind to a number that looks safe and running to the number that actually governs both your chemical bill and your tubes.
Why the LSI 2.0–3.0 band is the dangerous one
Below roughly LSI 1.5, LSI remains a defensible rough indicator. The water is dilute enough, the non-idealities small enough, that the textbook relationship is in the right neighborhood. It’s fine as a quick screen there.
But modern industrial programs — high cycles of concentration, reuse water, blended makeup, RO reject, hot skin temperatures — routinely operate in the LSI 2.0–3.0 band, exactly where the HEDP and polymeric-inhibitor ceilings live. This is precisely where:
- The true SR at any given LSI spans a wide, source-dependent range, and
- Operators are most likely to trust an LSI-based inhibitor limit to set acid feed, cycles, and dose.
You can hold LSI rock-steady at 2.5 on your daily report and have a true calcite saturation that has crossed HEDP’s failure ceiling because your makeup chemistry shifted. The index says your inhibitor is fine. The saturation says it stopped working. That is risk you carry without ever seeing it on a trend chart.
This isn’t just an LSI problem — RSI, PSI, and the rest inherit the same flaw
LSI is the headline, but the critique generalizes to the entire family of legacy carbonate indices, because they are all built on the same simplified pHs / single-mineral, ideal-solution foundation:
- Ryznar Stability Index (RSI) — A re-expression of the same Langelier pHs (RSI = 2·pHs − pH). It inherits every LSI limitation and adds a false air of empirical “stability” prediction.
- Puckorius Scaling Index (PSI) — Uses an equilibrium pH from alkalinity to improve on RSI for cooling water, but still rests on the same carbonate-only, simplified-activity framework.
- Larson–Skold, Aggressiveness Index, Stiff–Davis, and similar — Each patches one assumption while leaving the core ideal-solution, single-species problem intact.
Set an inhibitor limit on any of these and you inherit the same trap: the index moves smoothly while the true saturation — the thing your HEDP or polymeric inhibitor actually responds to — diverges underneath it.
The shortcut had a reason — and that reason is gone
For 90 years, the honest defense of LSI and its cousins was practicality. Rigorous speciation meant a geochemist, a workstation, and hours per analysis. In the field, a one-line index was the only realistic option.
That constraint no longer exists. Full saturation modeling — speciation across dozens of mineral phases, using true activities, ionic strength, ion pairing, and skin temperature — is now fast, inexpensive, and available. It runs in seconds. It can sit behind a calculator, a digital twin, or a routine field workflow. When a rigorous answer costs essentially nothing, continuing to base inhibitor-selection and million-dollar asset decisions on a 1936 approximation isn’t tradition — it’s an unforced, and now unnecessary, risk.
Historical indices for seawater: the Middle East / GCC Arabian-seawater problem the indices can no longer see
Everything above concerns relatively conventional fresh and brackish makeup. But the index-versus-saturation gap becomes far more consequential — and far more financially exposed — in the one place where industrial cooling now leans hardest on the ocean: the Gulf Cooperation Council (GCC) states of Saudi Arabia, the UAE, Qatar, Kuwait, Bahrain, and Oman, where seawater cooling and district cooling plants draw directly on the Arabian Gulf (Persian Gulf) for once-through and recirculating service. For high-salinity makeup, LSI was never the right tool; the industry standard there has long been the Stiff–Davis Stability Index (S&DSI) — a salinity-corrected carbonate index built specifically for seawater scaling and high-TDS brine. The trouble is that the same hidden flaw that undermines LSI in fresh water now undermines Stiff–Davis in the Arabian Gulf, and for a reason that is actively getting worse.
The Arabian Gulf is naturally cycling up. It is a shallow, semi-enclosed, evaporation-dominated sea, and over roughly the last ten years three forces have pushed its baseline salinity and carbonate content steadily higher: intensive seawater desalination discharging hypersaline reject brine, rising cooling-water abstraction and evaporative loss, and high regional evaporation in a warming climate. Intake TDS that a decade ago sat near typical seawater is now routinely 43,000–45,000 mg/L and climbing, with elevated calcium and alkalinity to match. The makeup itself is concentrating — before the cooling tower ever adds a single cycle on top.
That matters because of what it does to scaling control. Stiff–Davis, the traditional approach to CaCO₃ modeling in seawater, is no longer valid at these concentrations. Like LSI, S&DSI rests on a simplified, salinity-corrected pHs framework with an empirical K term; it was calibrated for a seawater chemistry that the Arabian Gulf has now drifted beyond. As the Gulf cycles up — and as a seawater-cooled tower then cycles that already-concentrated makeup further — the index compresses into a deceptively narrow band while the true calcite saturation runs away underneath it.
The figure below makes the danger explicit. Using a representative Arabian Gulf seawater intake analysis, evaluated with the rigorous Pitzer high-ionic-strength saturation model across cycles of concentration from 1.0 to 4.0 and heat-exchanger skin temperatures of 110–150°F, the traditional Stiff–Davis index moves through only a narrow span (roughly 1.1 to 2.5) while the true calcite saturation ratio, SR(calcite), climbs from about 10 to nearly 190 — an order of magnitude.
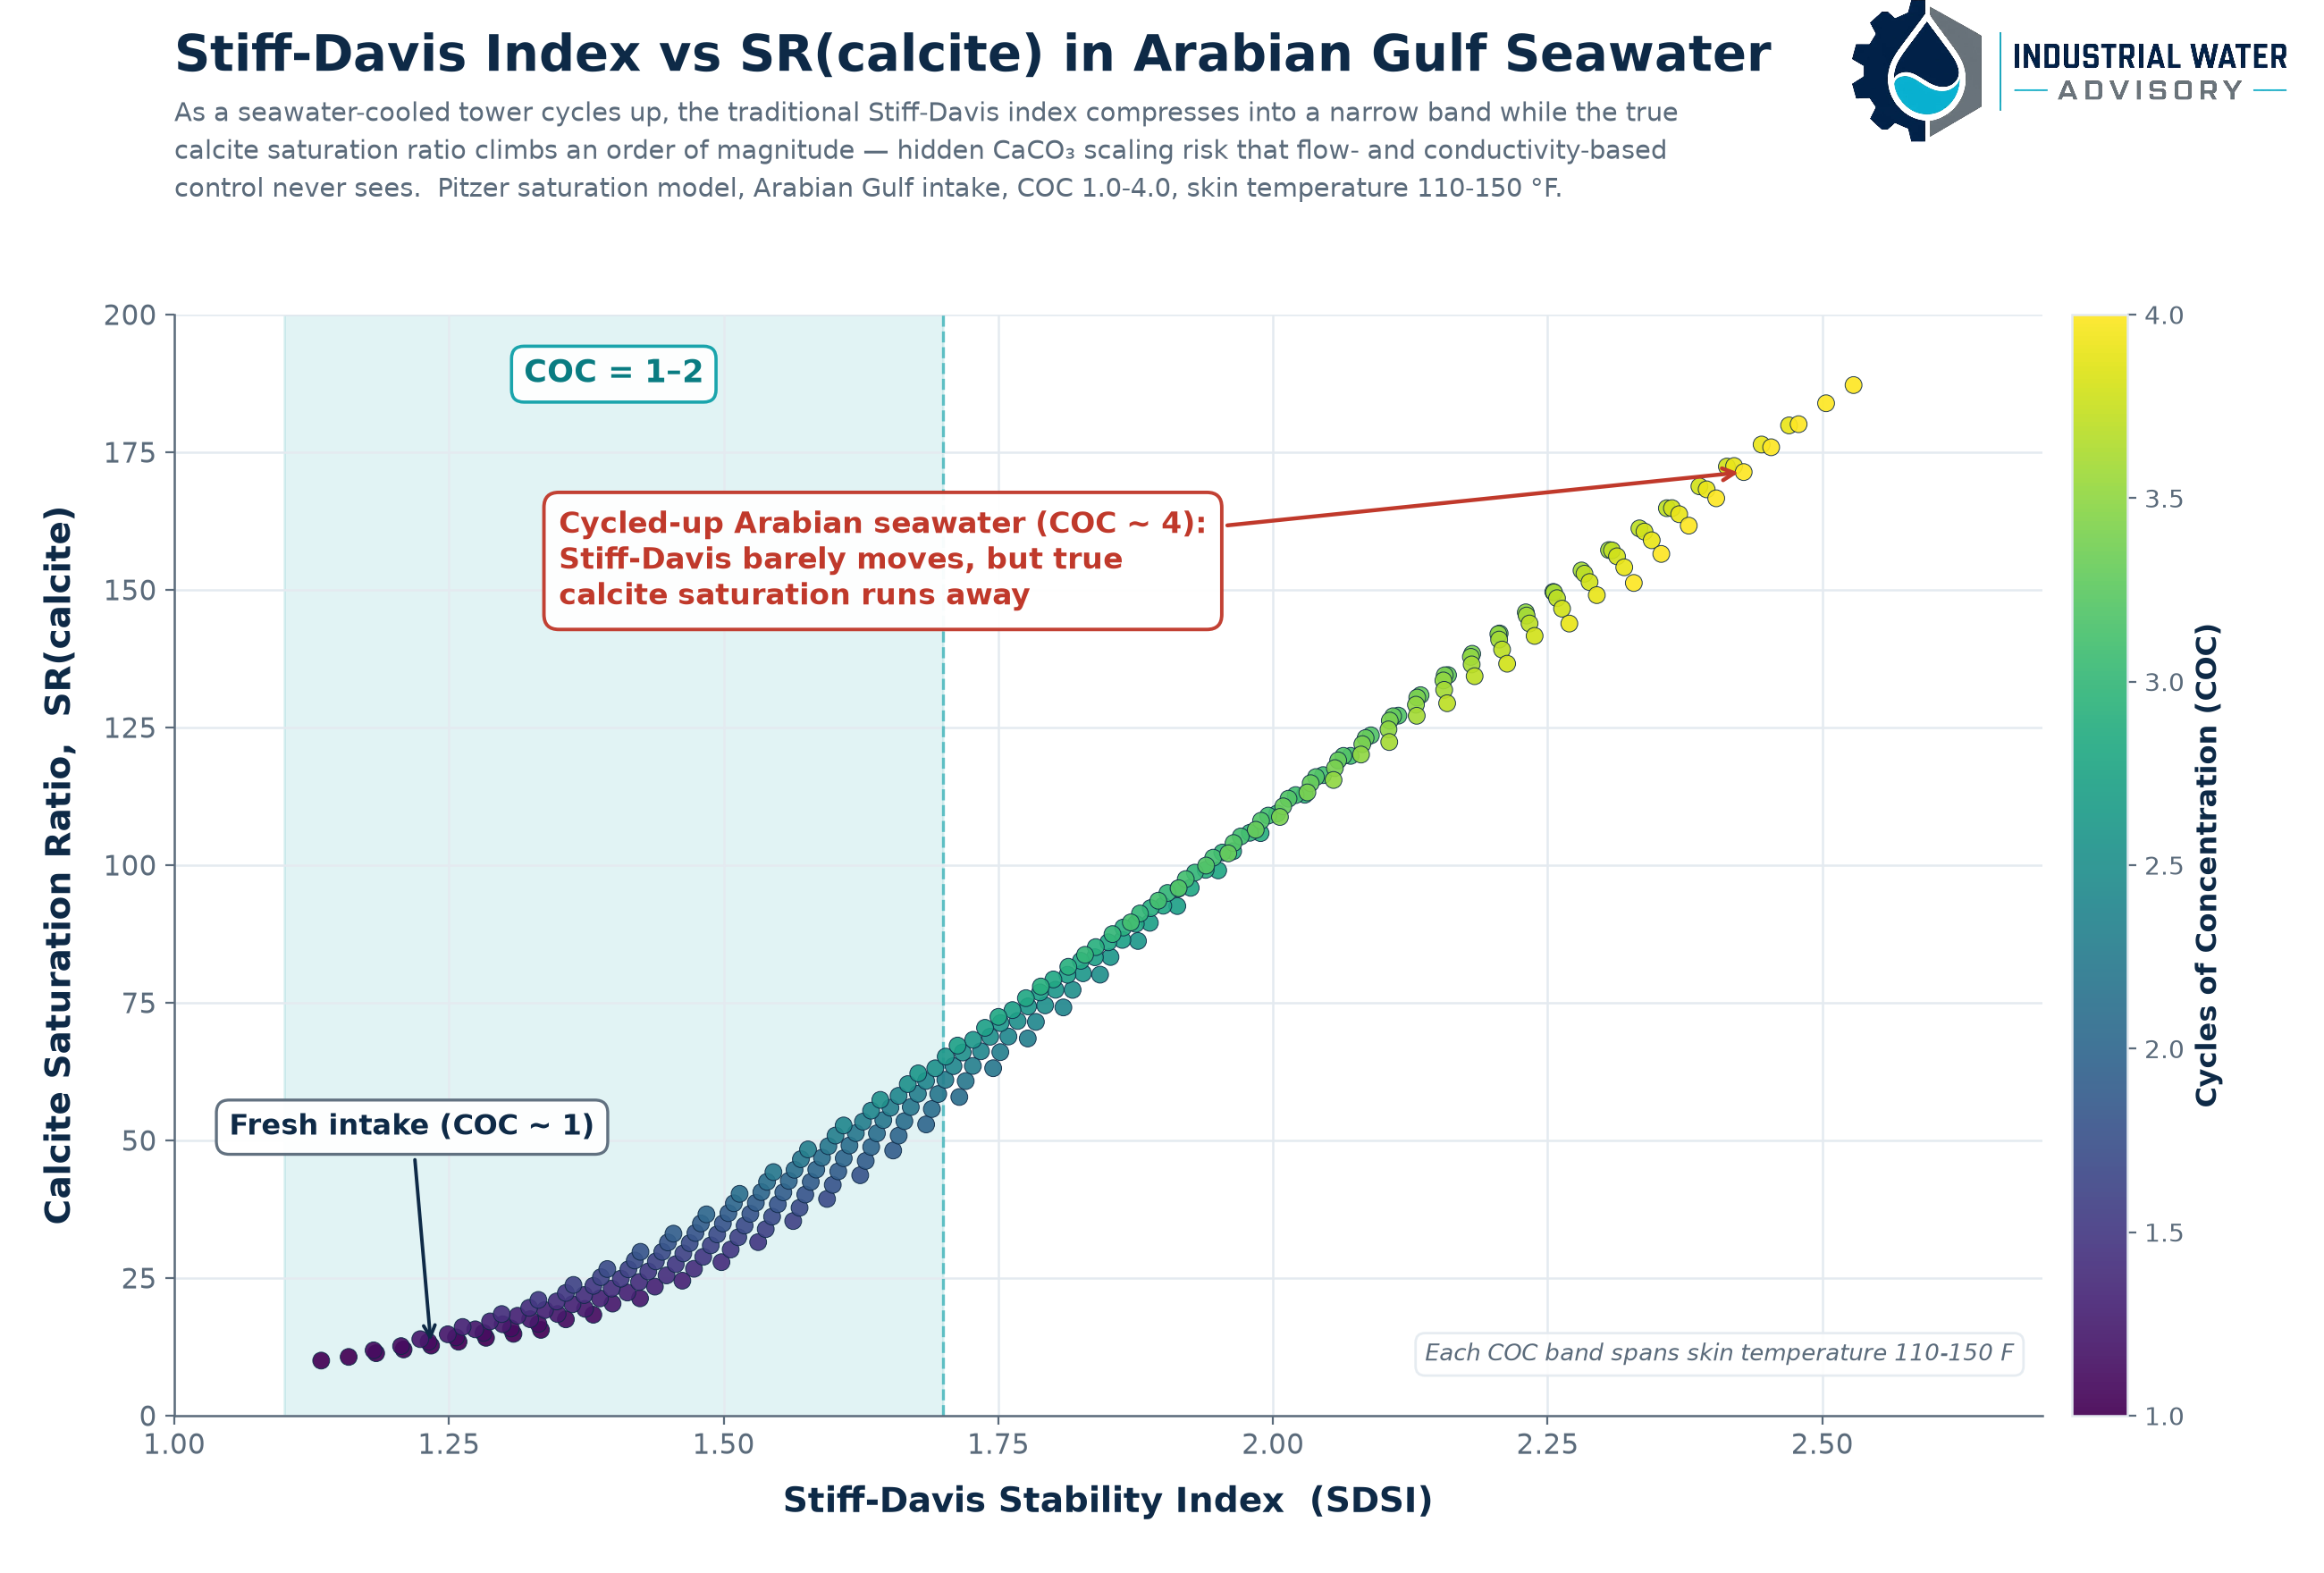
Read what that compression means on the plant floor. An operator controlling a GCC seawater-cooling or district-cooling system on flow, conductivity, and a Stiff–Davis target — the conventional control set — will see those parameters move only modestly as the system cycles up. Conductivity creeps. The Stiff–Davis number ticks up a few tenths and still reads inside its historical comfort zone. Everything on the daily report looks controlled. Meanwhile the actual calcium-carbonate supersaturation on the hot exchanger surfaces has multiplied several-fold, and CaCO₃ is being laid down on the tubes — a deposition risk that goes completely unnoticed in normal operations. This is the seawater analogue of the HEDP trap, only worse, because the makeup is concentrating on its own and the legacy index masks the trend even more aggressively at high ionic strength.
The fix is the same one this entire article argues for, applied to seawater: control on true SR(calcite) from a rigorous high-ionic-strength saturation model, not on Stiff–Davis. At Arabian Gulf salinity the Pitzer treatment of ion activity and ion pairing is essential — the simple Debye–Hückel/Davies activity corrections behind the legacy indices break down well before you reach 45,000 mg/L TDS, let alone cycled-up tower water beyond it. Inhibitor selection, dosage optimization, acid feed, and cycle limits for seawater cooling towers, SWRO-adjacent cooling loops, and district cooling in the GCC all need to be set on the saturation that physically governs deposition.
This is an introduction to seawater saturation analysis, not the last word on it. The full treatment — aragonite versus calcite in seawater, the role of magnesium and sulfate in the Arabian Gulf matrix, brine-side scaling, and inhibitor performance ceilings specifically in high-salinity service — is its own subject. A dedicated deep-dive on Arabian-seawater scaling and saturation modeling for GCC cooling is coming in a future article. For now, the headline for any Middle East operator is simple: if you are still controlling seawater cooling on Stiff–Davis, conductivity, and flow, the Gulf has very likely moved out from under your index — and your plates and/or tubes may be telling a different story than your control room.
What to do instead
- Express every inhibitor limit in true SR, not LSI. Know your inhibitor’s real saturation ceiling — HEDP fails around SR(calcite) ≈ 145, polymeric CaCO₃ inhibitors around SR ≈ 220 — and run to that, not to an index value.
- Stop using LSI (or RSI/PSI) as your control target. Use it, at most, as a fast directional screen below LSI ~1.5.
- Set control limits on true saturation ratio for the actual minerals at risk — calcite, aragonite, the calcium phosphates, silica, and metal hydroxides relevant to your program.
- Model at skin/surface temperature, not bulk temperature. Scale forms on the hot metal, not in the basin.
- Trend the saturation state, not the index. Watch the number that physically governs whether your inhibitor still holds.
- Separate the scaling question from the corrosion question entirely. Saturation modeling answers “will it deposit?” Corrosion requires its own framework.
The bottom line
LSI was never wrong about what it measures. It was only ever a directional flag for calcium carbonate’s tendency to precipitate or dissolve in simple waters — never a corrosion index, never a scaling rate, and never the truth about whether your inhibitor is still working.
The risk isn’t in the index. The risk is in trusting it to set inhibitor limits it was never built to set, in conditions it was never validated for, now that a better answer is free. If your program still calls HEDP “safe at LSI 2.5” or a polymeric CaCO₃ inhibitor “safe at LSI 3.0,” there’s a real chance your inhibitor has already crossed its true saturation ceiling — HEDP at SR ≈ 145, the polymeric inhibitor at SR ≈ 220, only a little above it — and your index is telling you everything is fine.
Work with Industrial Water Advisory
I help refineries, petrochemical plants, power generation, district cooling, and data center operators and associated water treatment service companies understand their operations, risk, opportunities for optimization, and improve contract management and relationships. Where I most often add value:
- Complete System Review and Engineering Report with full multi-year analysis, onsite review and investigation, documentation and recommendations for optimization of cost and minimization of risk
- Validate an existing program against the chemistry.
- Identify hidden scaling and deposition risk before it costs you
- Find cost savings in over-conservative programs
- Review recent or recurring failures
- Second-opinion and benchmarking – Not sure what your status is or how you compare in the industry? We can help with that.
- RFP development, Contract negotiation, and Contract Oversight
Whether you want a focused look at one troublesome system or a portfolio-wide review across multiple sites, the engagement scales to the question.
Independent technical authority. No chemistry to sell. No supplier agenda.